Note
Go to the end to download the full example code
Spherical Data
Originally posted: pyvista/pyvista-support#67
See also https://docs.pyvista.org/examples/02-plot/spherical.html
import numpy as np
import pooch
import pyvista as pv
import xarray as xr

url = "https://raw.githubusercontent.com/pyvista/vtk-data/master/Data/lsm_4x5.nc"
file_path = pooch.retrieve(url=url, known_hash=None)

lsm = xr.open_dataarray(file_path)

xx, yy, zz = np.meshgrid(
    np.radians(
        np.arange(
            0,
            365,
            5,
        )
    ),
    np.radians(np.arange(-90, 94, 4)),
    [0],
)
Transform to spherical coordinates
radius = 6371.0e6
x = radius * np.cos(yy) * np.cos(xx)
y = radius * np.cos(yy) * np.sin(xx)
z = radius * np.sin(yy)
Create PyVista mesh
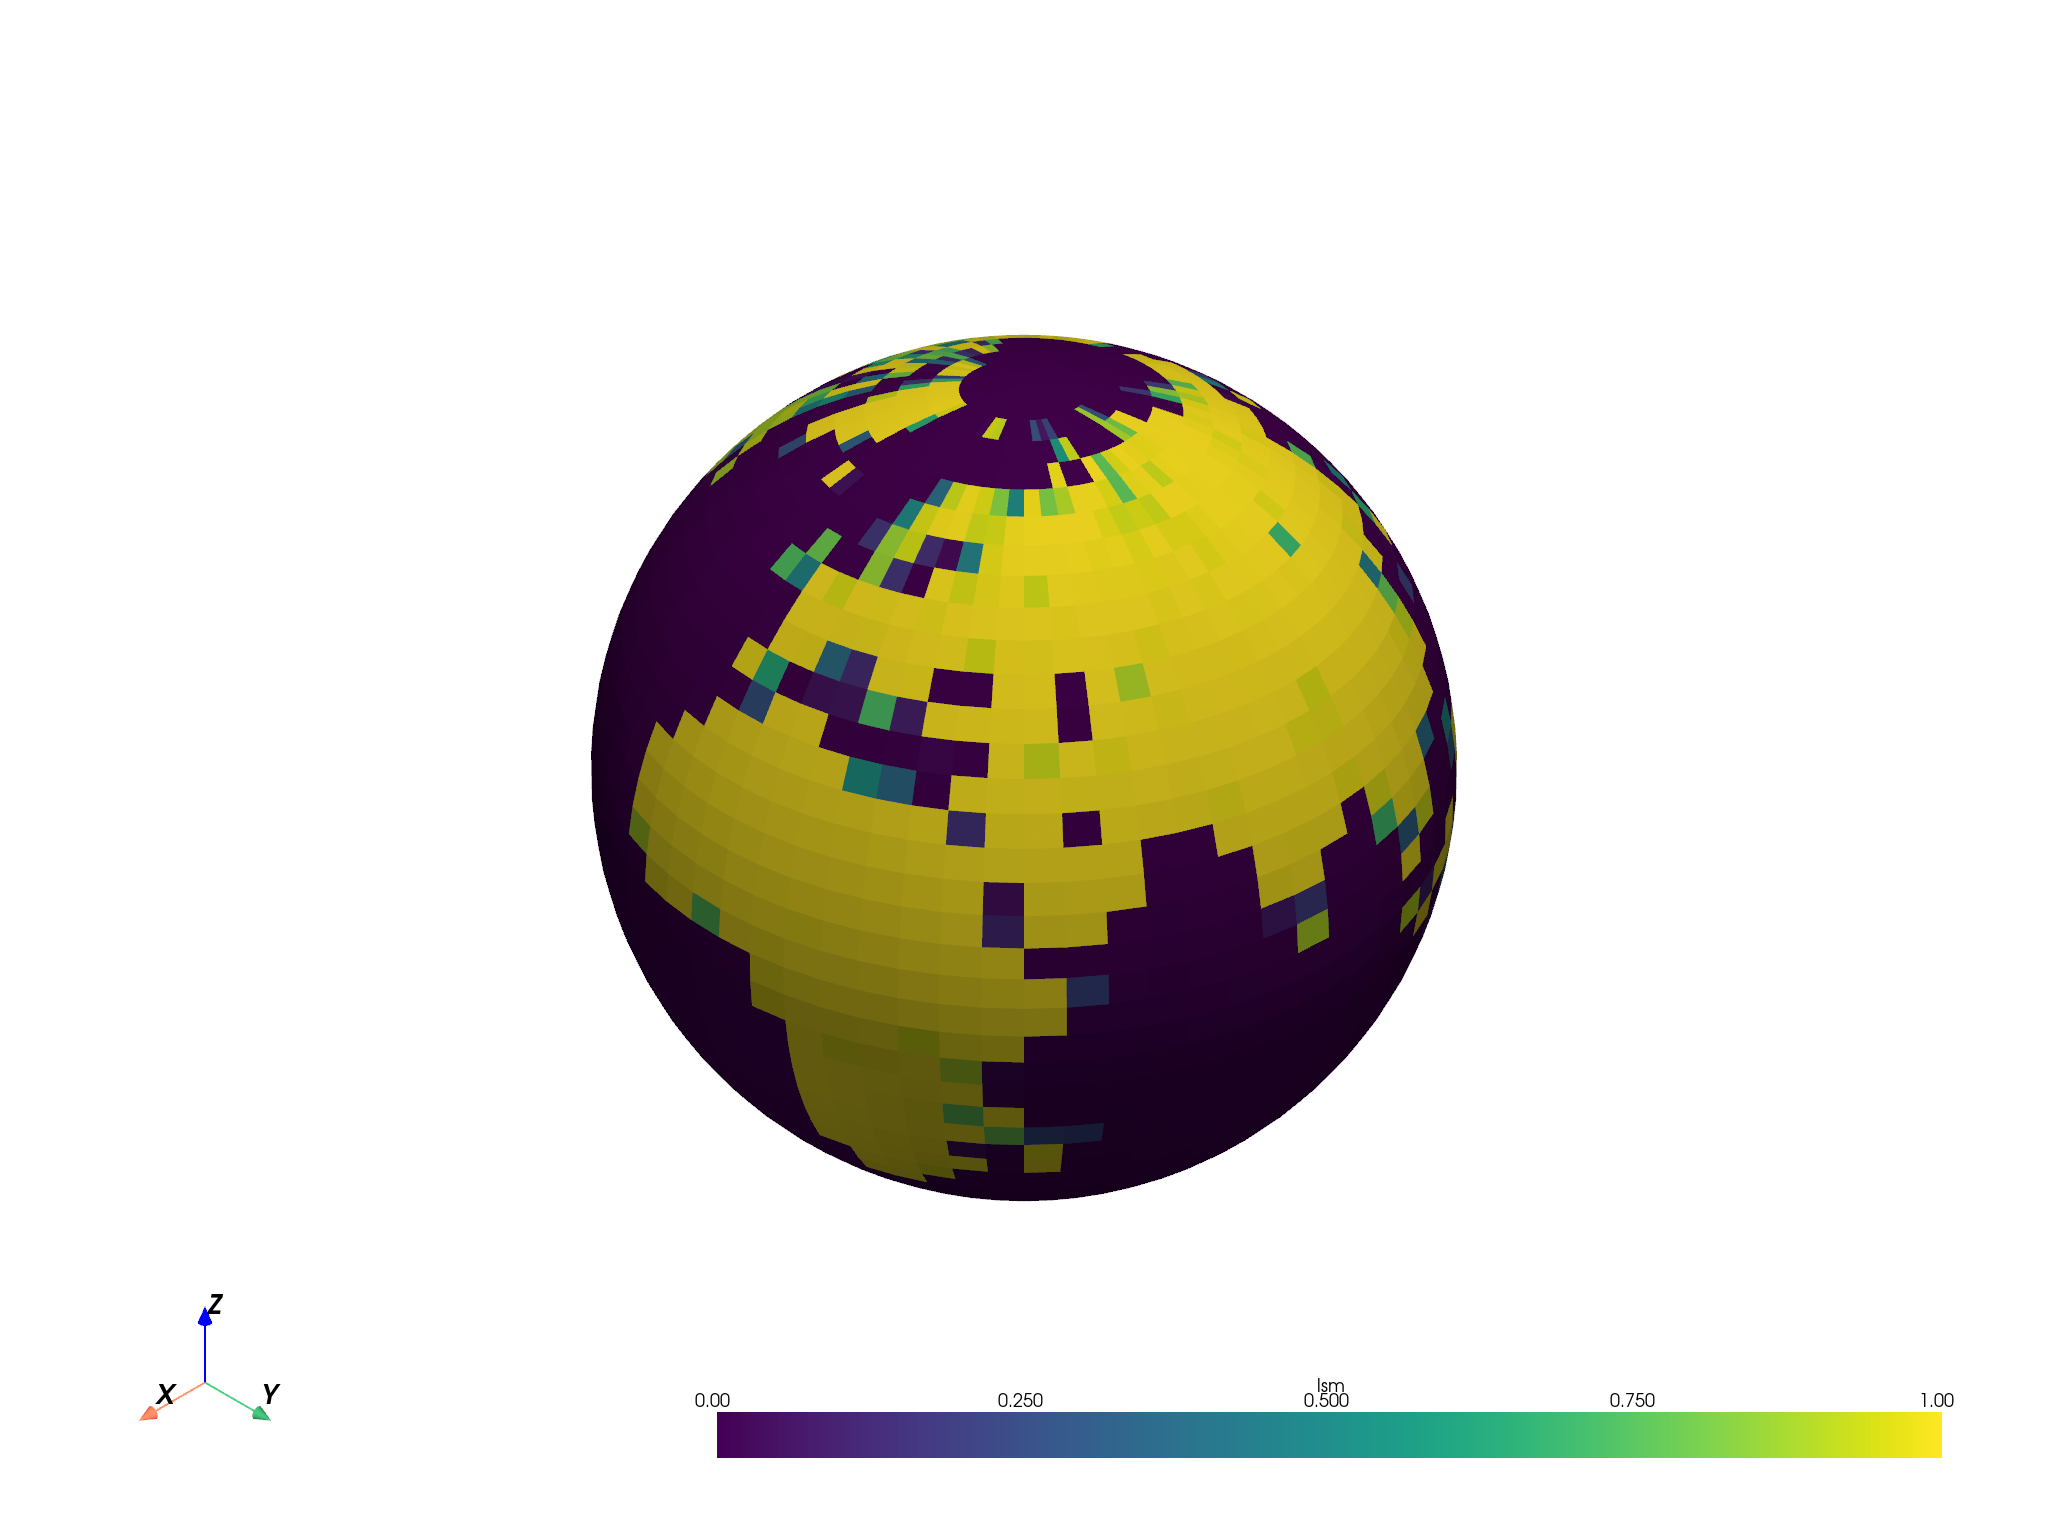
grid = pv.StructuredGrid(x, y, z)
grid.cell_data["lsm"] = np.array(lsm).ravel(order="F")
Visualize!
grid.plot()

Total running time of the script: (0 minutes 1.544 seconds)