Note
Go to the end to download the full example code
Creating a Contour Map
Creating a contour map from a DEM mesh
# sphinx_gallery_thumbnail_number = 2
import matplotlib.pyplot as plt
import numpy as np
import pooch
import pyvista as pv
url = "https://raw.githubusercontent.com/pyvista/vtk-data/master/Data/Sio020320.vtp"
file_path = pooch.retrieve(url=url, known_hash=None)
mesh = pv.read(file_path).elevation()
mesh
Downloading data from 'https://raw.githubusercontent.com/pyvista/vtk-data/master/Data/Sio020320.vtp' to file '/home/runner/.cache/pooch/c0c6a619beaa06db63dfe7593cb5578f-Sio020320.vtp'.
SHA256 hash of downloaded file: eb4df0c0e1925f972023f798d81fd778027985ad9c25a2c57b49242fbeb74b16
Use this value as the 'known_hash' argument of 'pooch.retrieve' to ensure that the file hasn't changed if it is downloaded again in the future.
Get a min/max range of the elevation
z = mesh["Elevation"]
mi, ma = round(min(z), ndigits=-2), round(max(z), ndigits=-2)
mi, ma
(5100.0, 5400.0)
create values to contour at
step = 10
cntrs = np.arange(mi, ma + step, step)
cntrs
array([5100., 5110., 5120., 5130., 5140., 5150., 5160., 5170., 5180.,
       5190., 5200., 5210., 5220., 5230., 5240., 5250., 5260., 5270.,
       5280., 5290., 5300., 5310., 5320., 5330., 5340., 5350., 5360.,
       5370., 5380., 5390., 5400.])
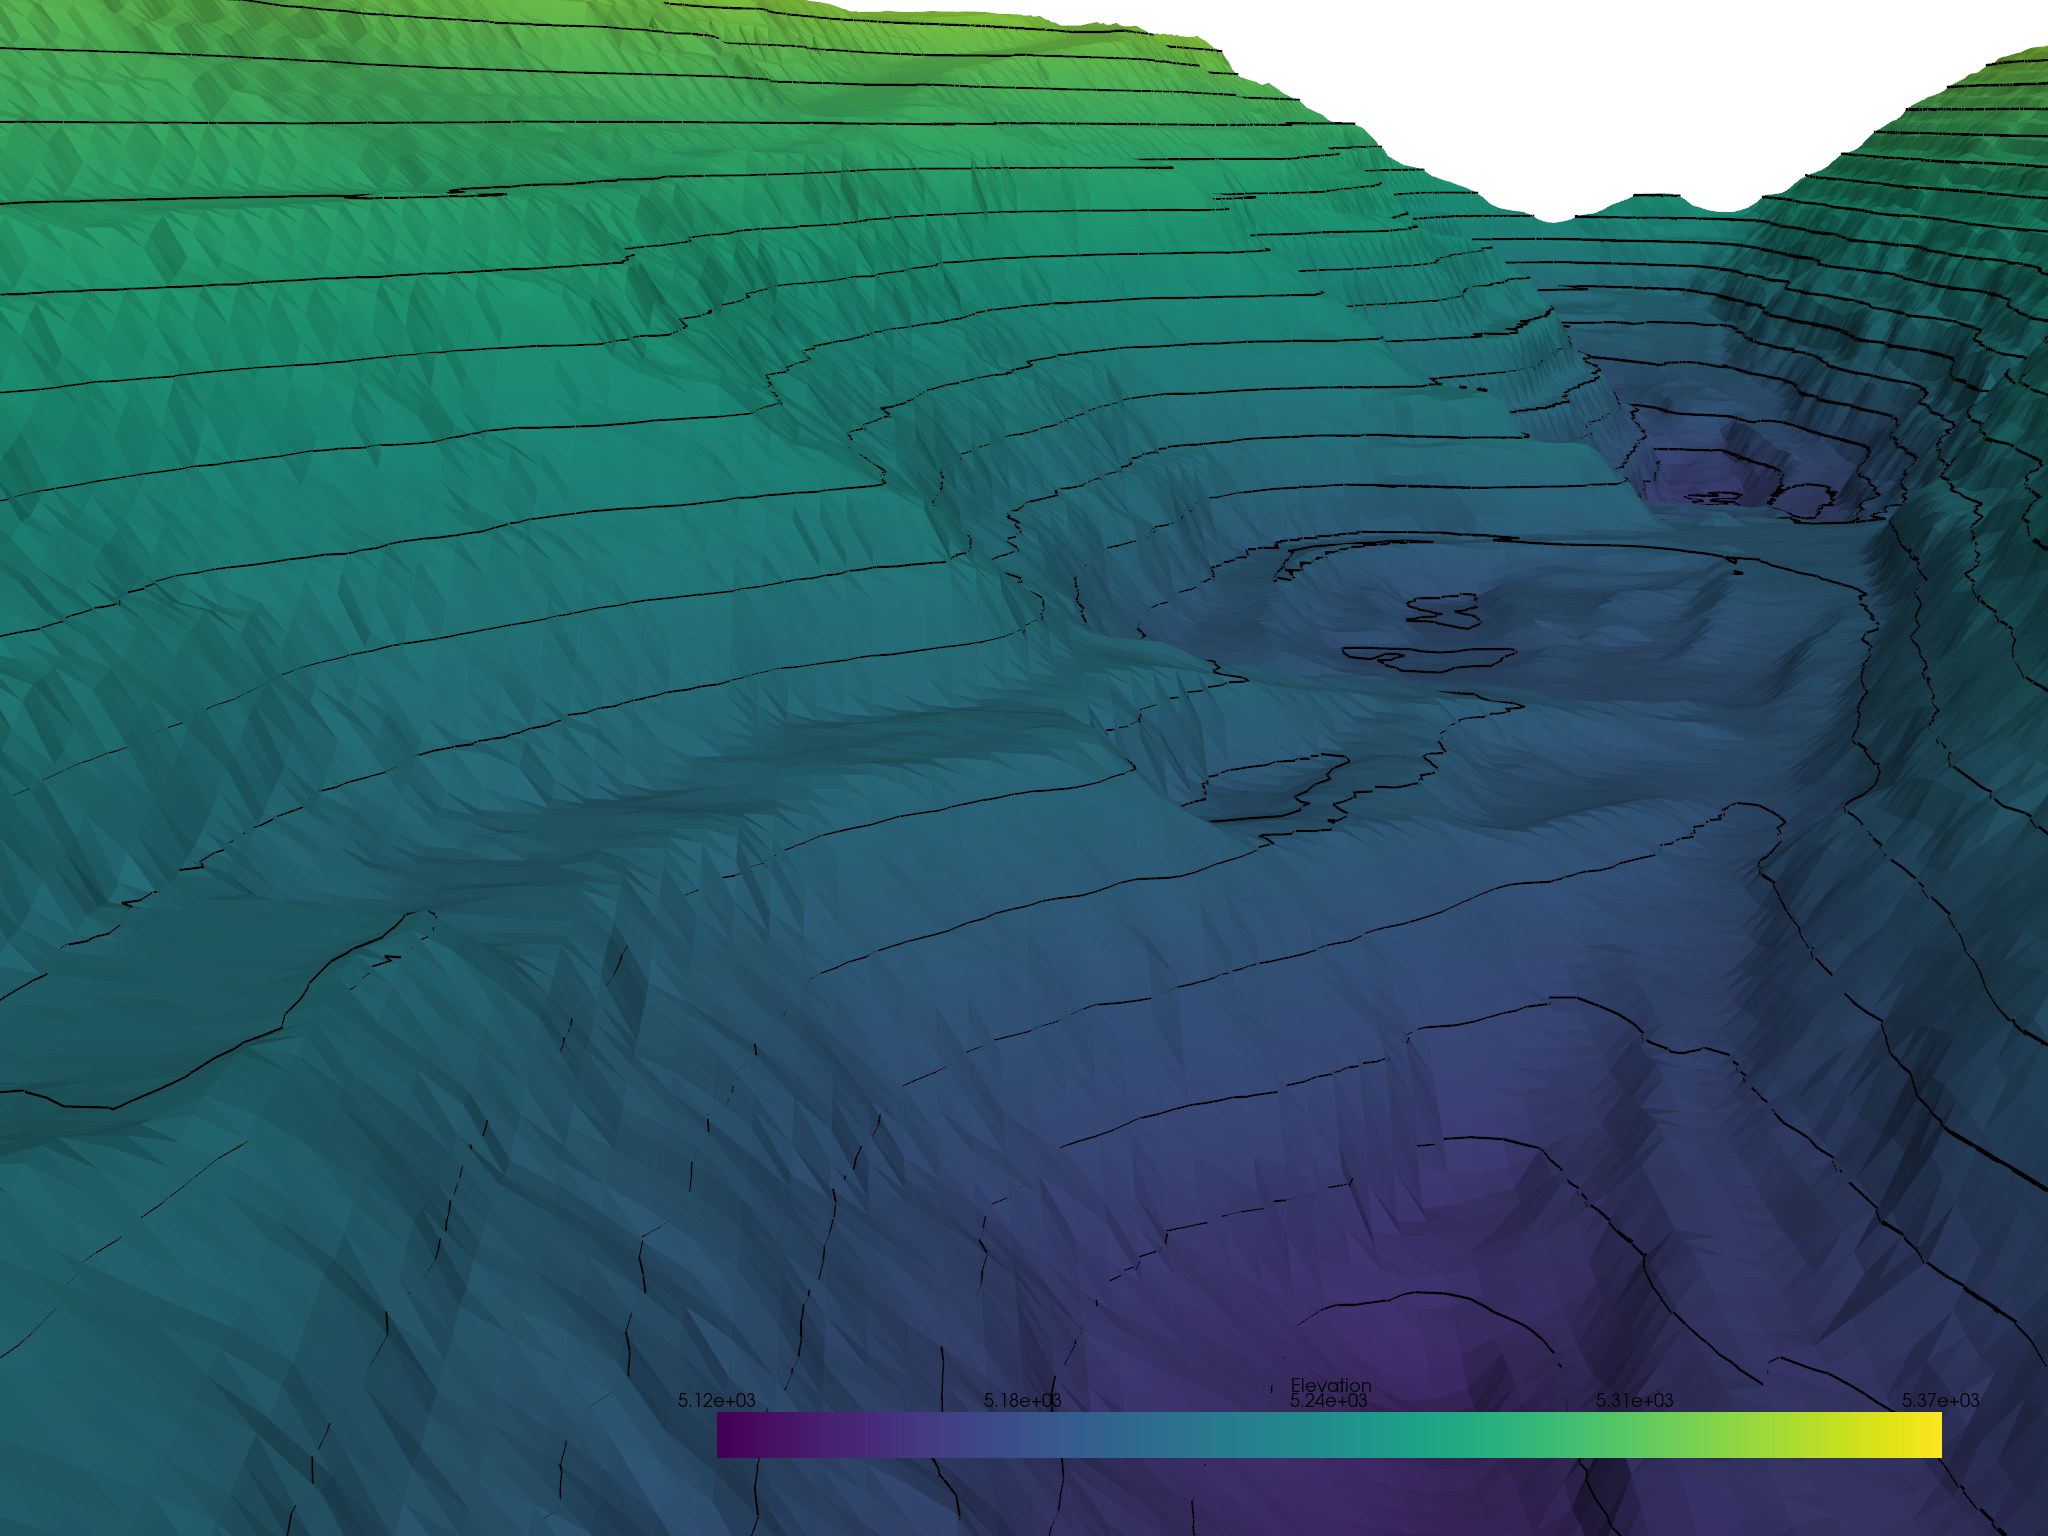
Run the contouring filter
contours = mesh.contour(cntrs, scalars="Elevation")
p = pv.Plotter()
p.add_mesh(mesh)
p.add_mesh(contours, line_width=5, color="black")
p.camera_position = [
    (469978.85959530954, 1322266.5229163894, 5293.630545897349),
    (469956.03091019404, 1321834.8498636105, 5194.622946764996),
    (0.0037194010444579987, -0.2237385074834842, 0.9746421119184896),
]
p.show()
Create a 2D contour map
x, y = contours.points[:, 0], contours.points[:, 1]

plt.scatter(x, y, s=1, marker=".")
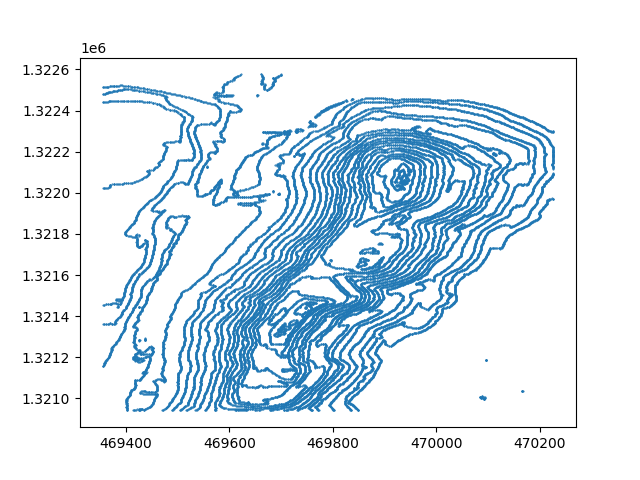
<matplotlib.collections.PathCollection object at 0x7f2f5f1aefd0>
Total running time of the script: (0 minutes 5.023 seconds)