Note
Go to the end to download the full example code
Masked Grid for Two Sides of a Fault
In this example, I demonstrate how to use a surface mesh of a fault in the subsurface to create a data mask on a modeling grid. This is a particularly useful exercise for scenarios where you may want to perform some sort of modeling in a different manner due to geological differences on the two sides of the fault - but still have a single modeling grid.
Let’s get to it!
# sphinx_gallery_thumbnail_number = 4
import numpy as np
import pooch
import pyvista as pv
url = "https://raw.githubusercontent.com/pyvista/vtk-data/master/Data/opal_mound_fault.vtk"
file_path = pooch.retrieve(url=url, known_hash=None)
fault = pv.read(file_path)
fault
Create the modelling grid if you don’t already have one
grid = pv.UniformGrid()
# Bottom south-west corner
grid.origin = (329700, 4252600, -2700)
# Cell sizes
grid.spacing = (500, 500, 500)
# Number of cells in each direction
grid.dimensions = (30, 35, 10)
grid
/opt/hostedtoolcache/Python/3.8.18/x64/lib/python3.8/site-packages/pyvista/core/grid.py:912: PyVistaDeprecationWarning: `UniformGrid` is deprecated. Use `ImageData` instead.
  warnings.warn(
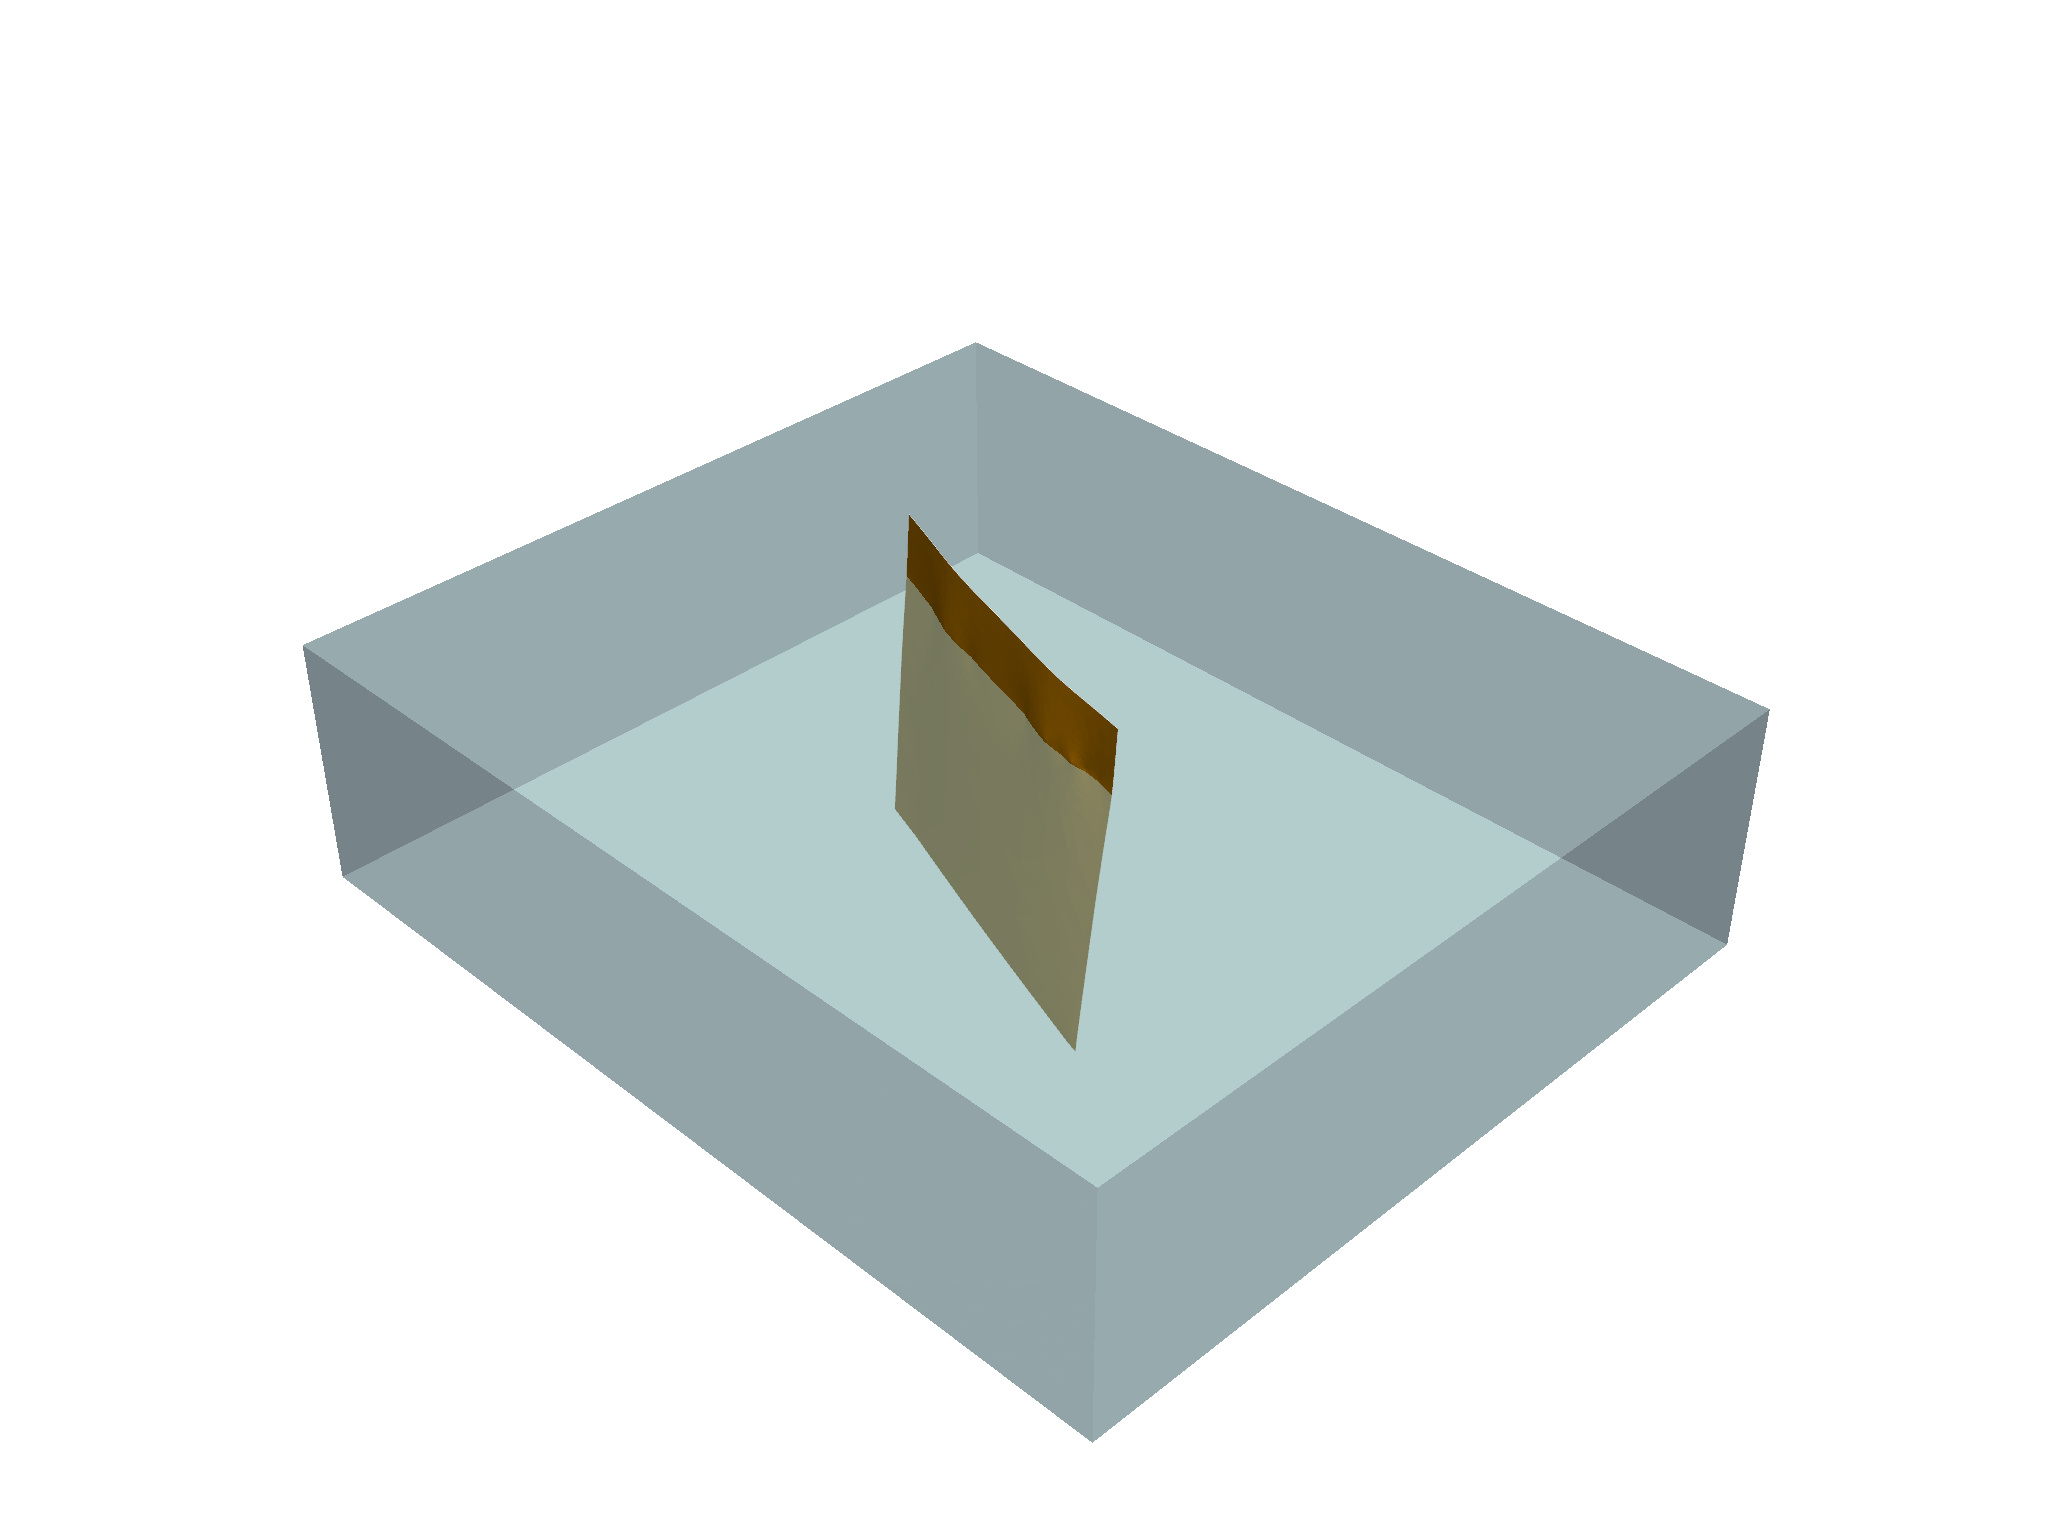
Take a quick preview to see where the fault is inside of the grid
p = pv.Plotter()
p.add_mesh(grid, opacity=0.5)
p.add_mesh(fault, color="orange")
p.show()

You may notice that the modeling grid’s extent is far greater than that of the fault – not to worry! PyVista’s clip_surface filter and the utility I’m going to share below handles this quite well by interpolating the fault’s plane outward.
This is a reusable utility for performing the mask:
def mask_mesh_by_surface(mesh, surface):
    grid = mesh.copy()
    # Split the mesh by the fault
    grid["pids"] = np.arange(grid.n_points)
    grid["cids"] = np.arange(grid.n_cells)
    a = grid.clip_surface(surface, invert=False, compute_distance=True)
    b = grid.clip_surface(surface, invert=True, compute_distance=True)
    # Inject the mask
    grid["cell_mask"] = np.zeros(grid.n_cells, dtype=int)
    grid["cell_mask"][a["cids"]] = 1
    grid["cell_mask"][b["cids"]] = 2
    # Use implicit distance to get point mask
    lpids = np.argwhere(grid["implicit_distance"] >= 0)
    gpids = np.argwhere(grid["implicit_distance"] < 0)
    grid["point_mask"] = np.zeros(grid.n_points, dtype=int)
    grid["point_mask"][lpids] = 1
    grid["point_mask"][gpids] = 2
    return grid
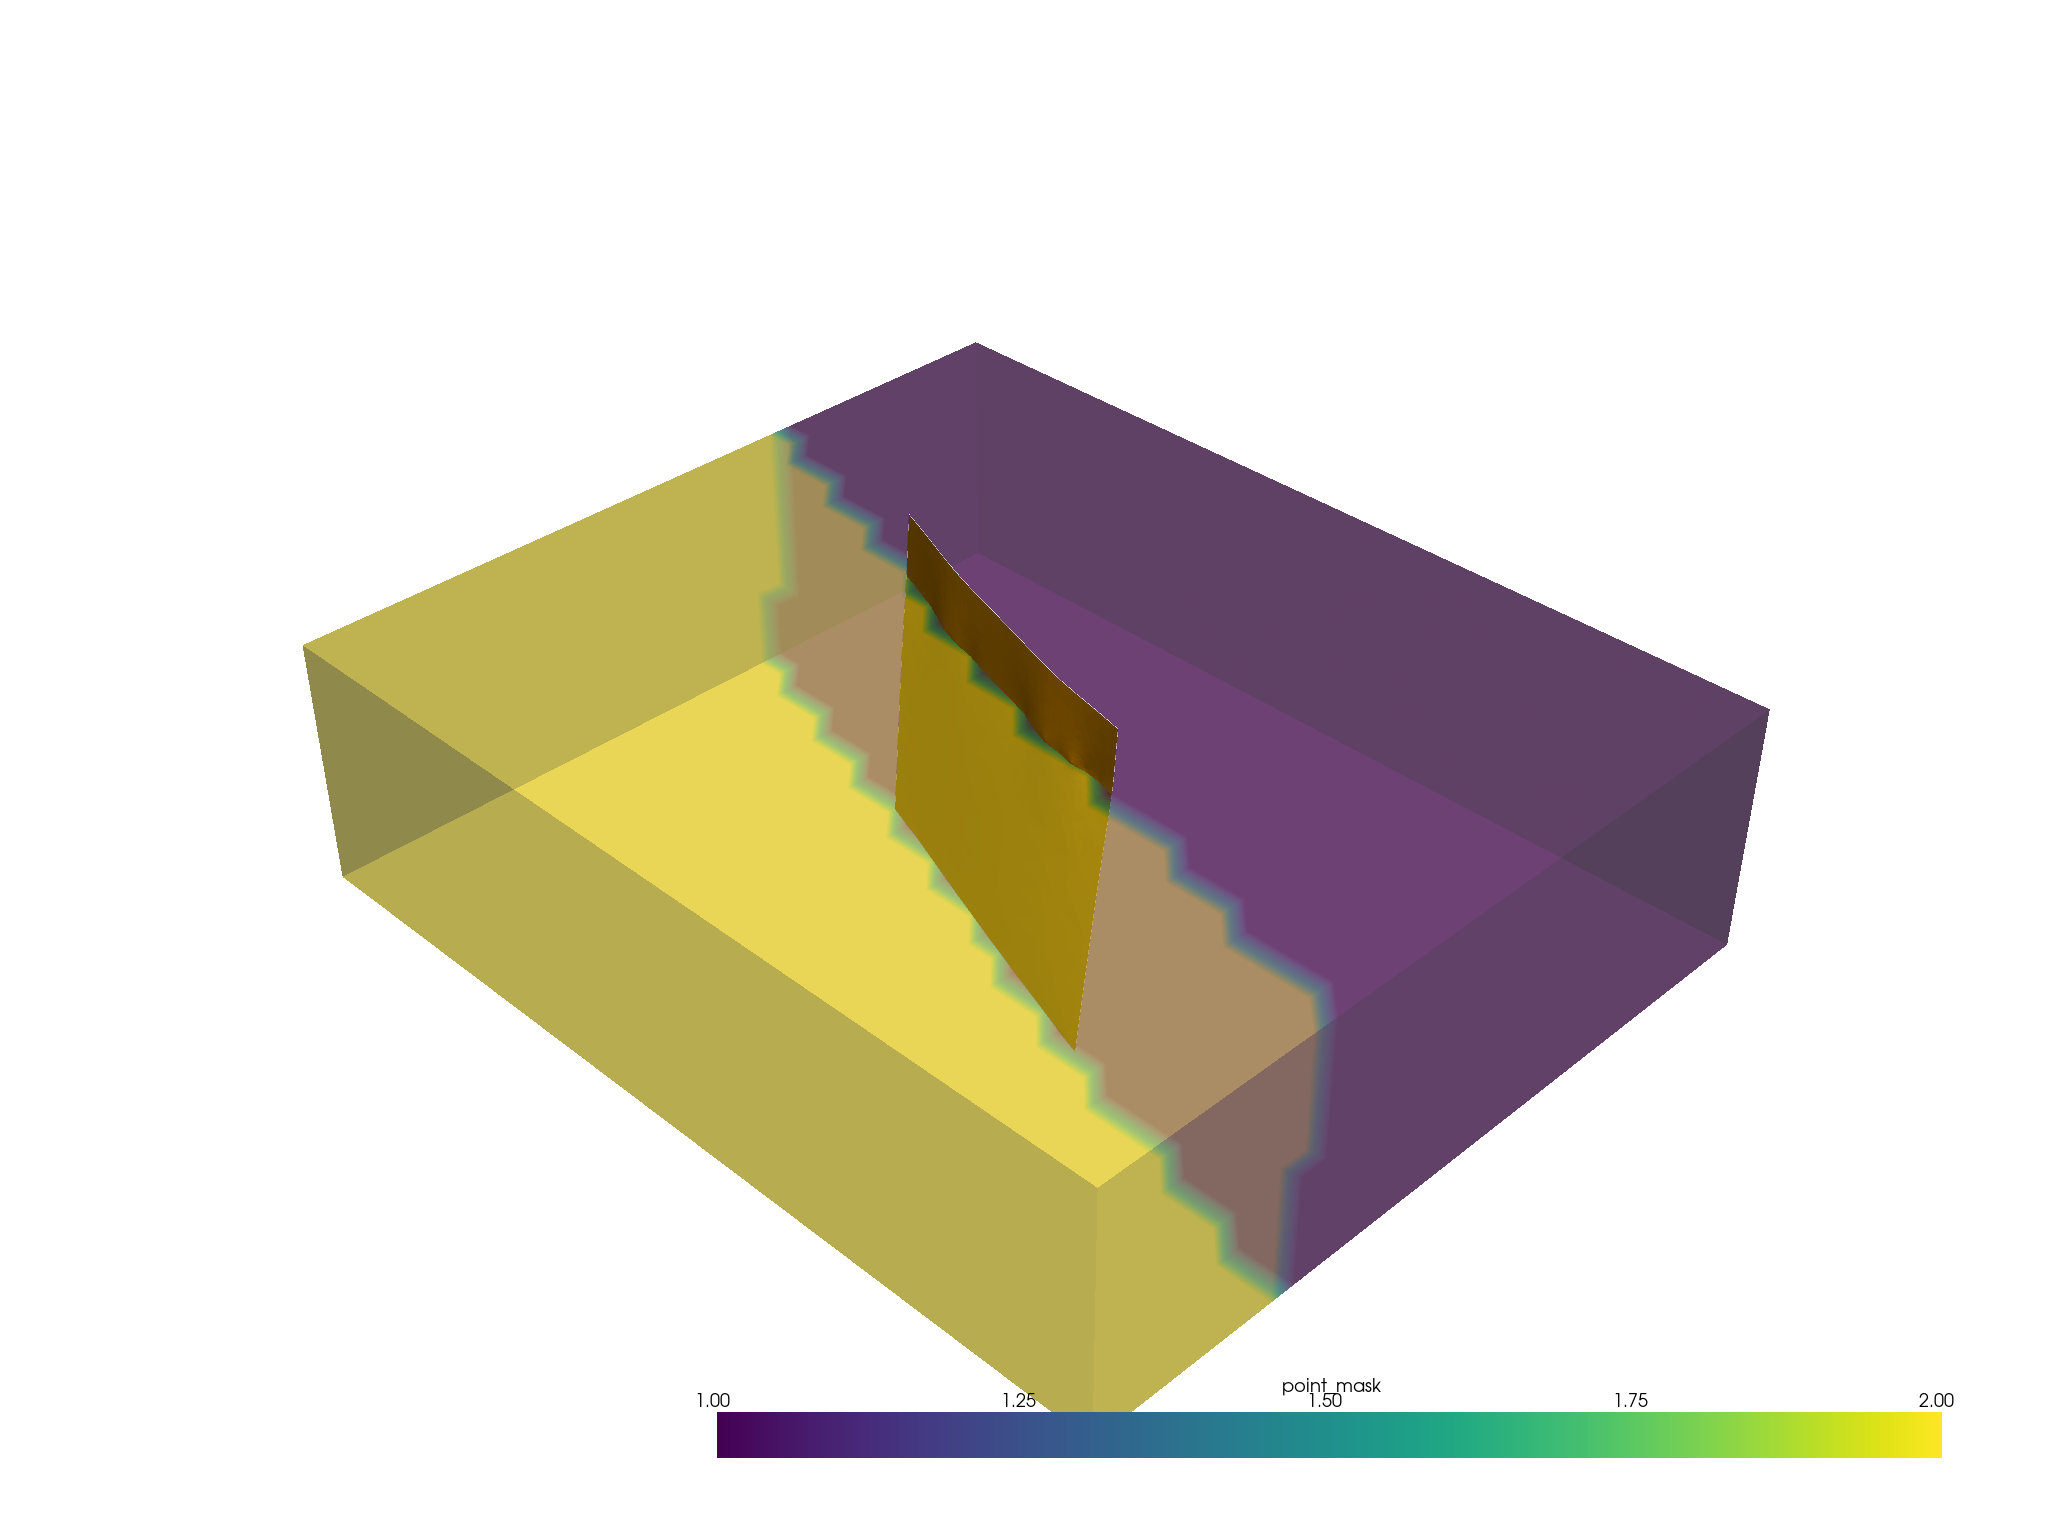
Let’s run it and take a look at the result!
masked = mask_mesh_by_surface(grid, fault)

p = pv.Plotter()
p.add_mesh(fault, color="orange")
p.add_mesh(masked, scalars="point_mask", opacity=0.5)
p.show()

/opt/hostedtoolcache/Python/3.8.18/x64/lib/python3.8/site-packages/pyvista/core/grid.py:912: PyVistaDeprecationWarning: `UniformGrid` is deprecated. Use `ImageData` instead.
  warnings.warn(
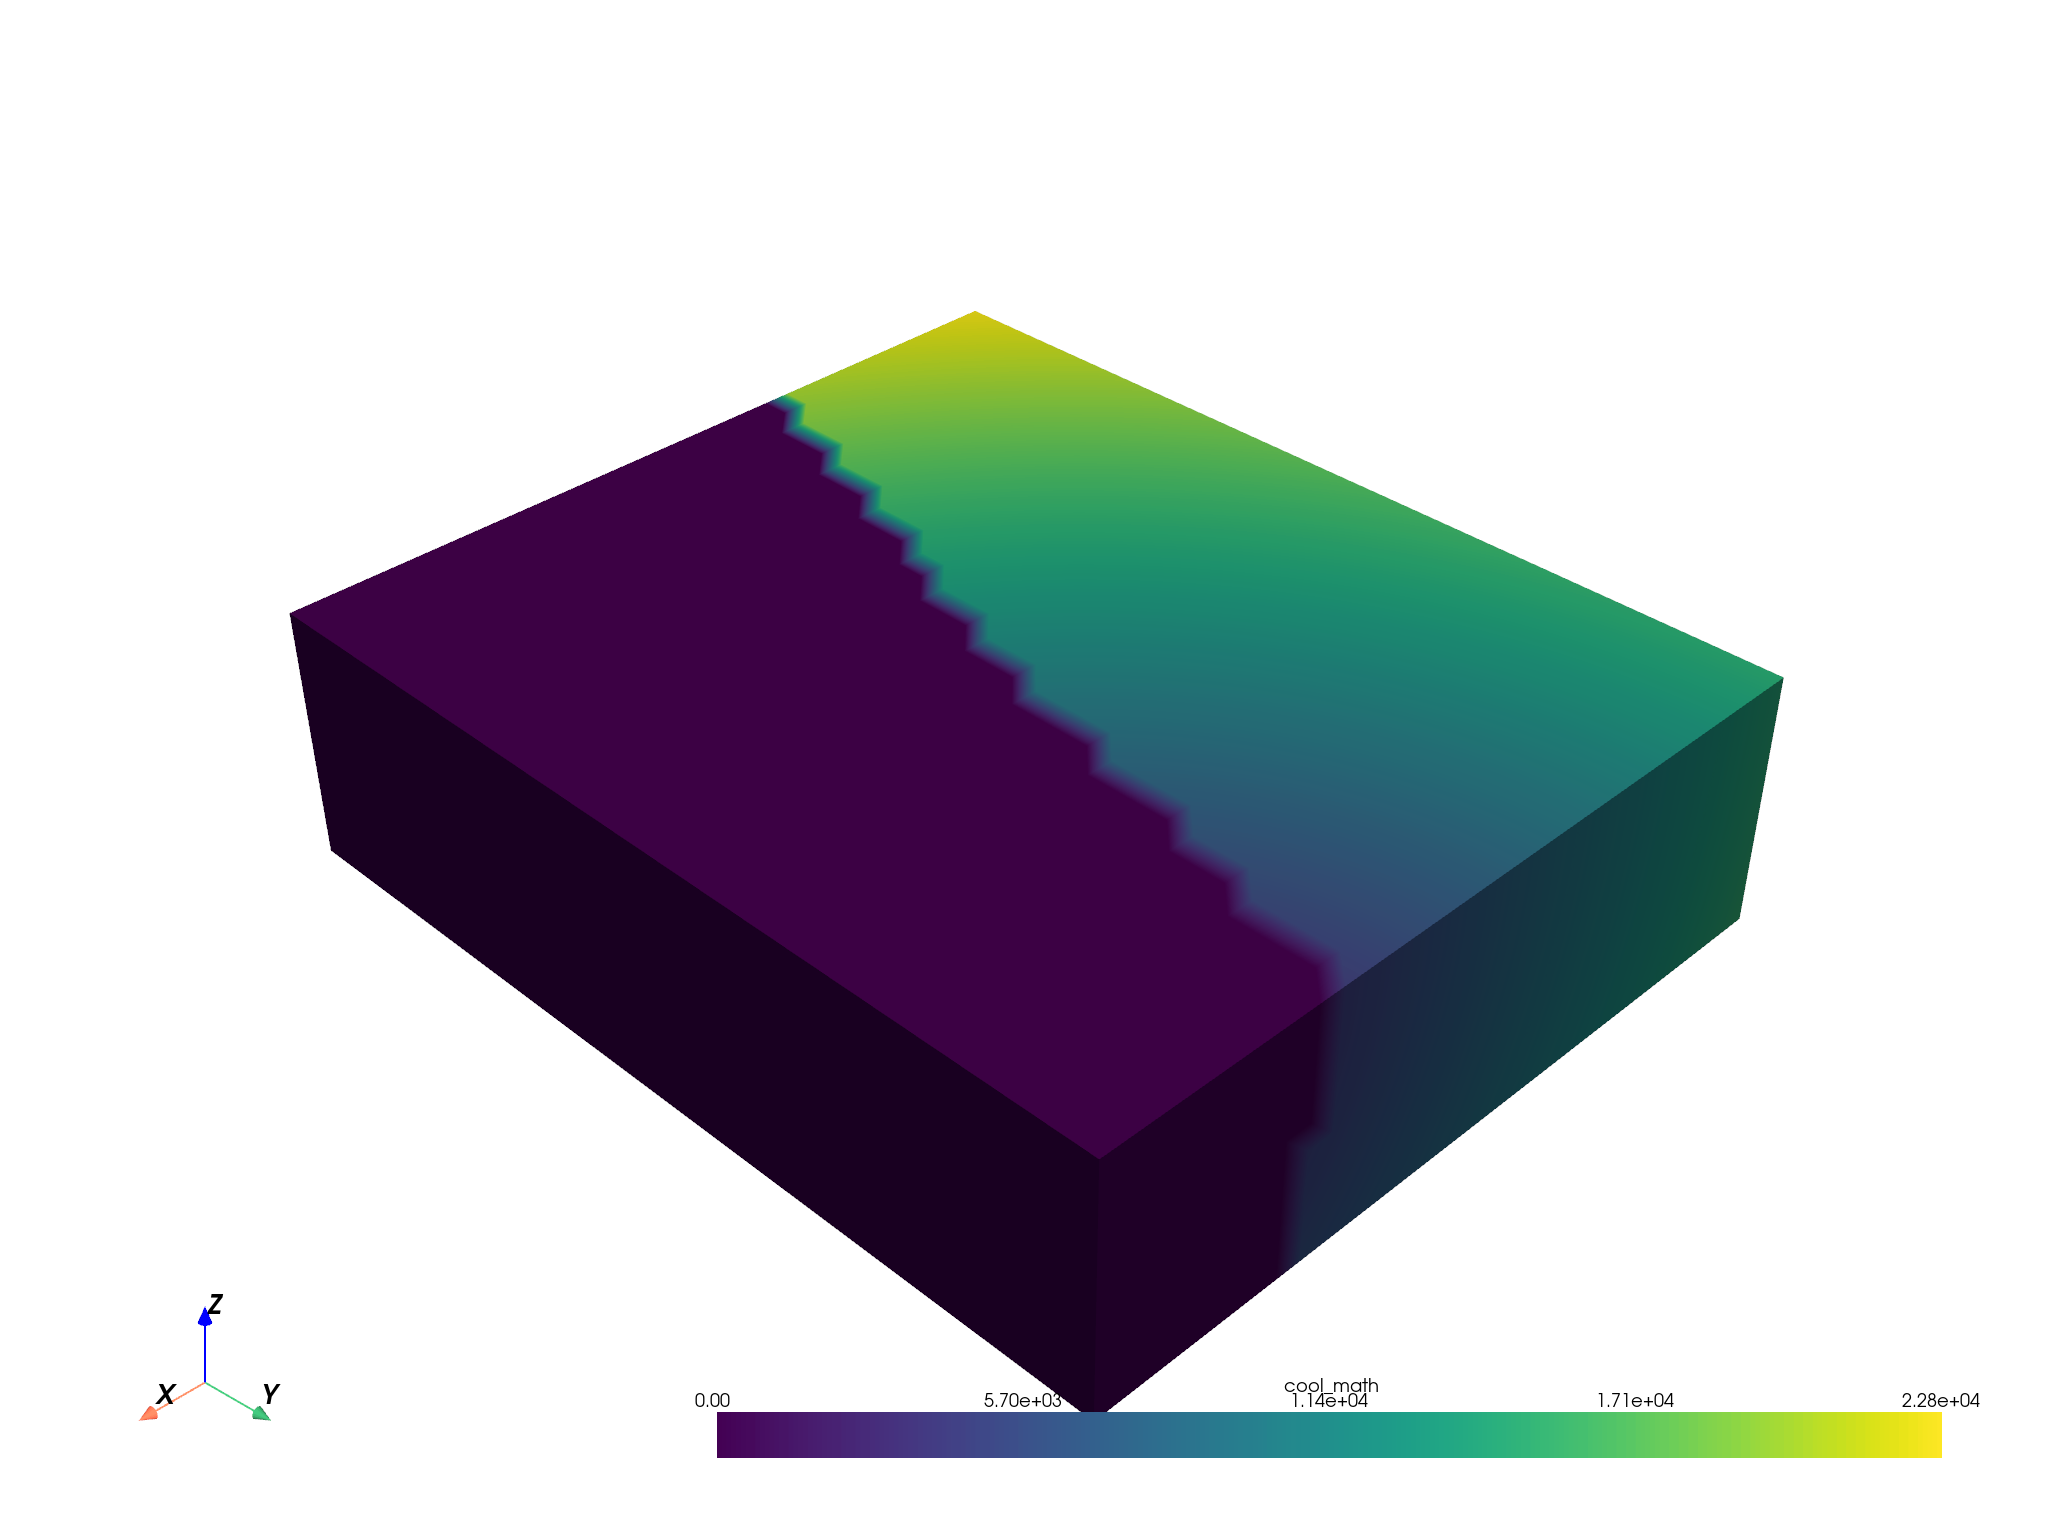
And here is how you might use that mask to do some sort of fancy modeling. In my example, I’m going to use a rather sophisticated distance calculation:
ids = np.argwhere(masked["point_mask"] == 1).ravel()
pts = grid.points[ids]
len(pts)
5659
Compute distance from TNE corner
compute = lambda a, b: np.sqrt(np.sum((b - a) ** 2, axis=1))
dist = compute(pts, np.repeat([masked.bounds[1::2]], pts.shape[0], axis=0))
Add those results back to the source grid
masked["cool_math"] = np.zeros(grid.n_points)  # Need to preallocate
masked["cool_math"][ids] = dist

# Do some different math for the other side
...
Ellipsis
Display!
masked.plot(scalars="cool_math")

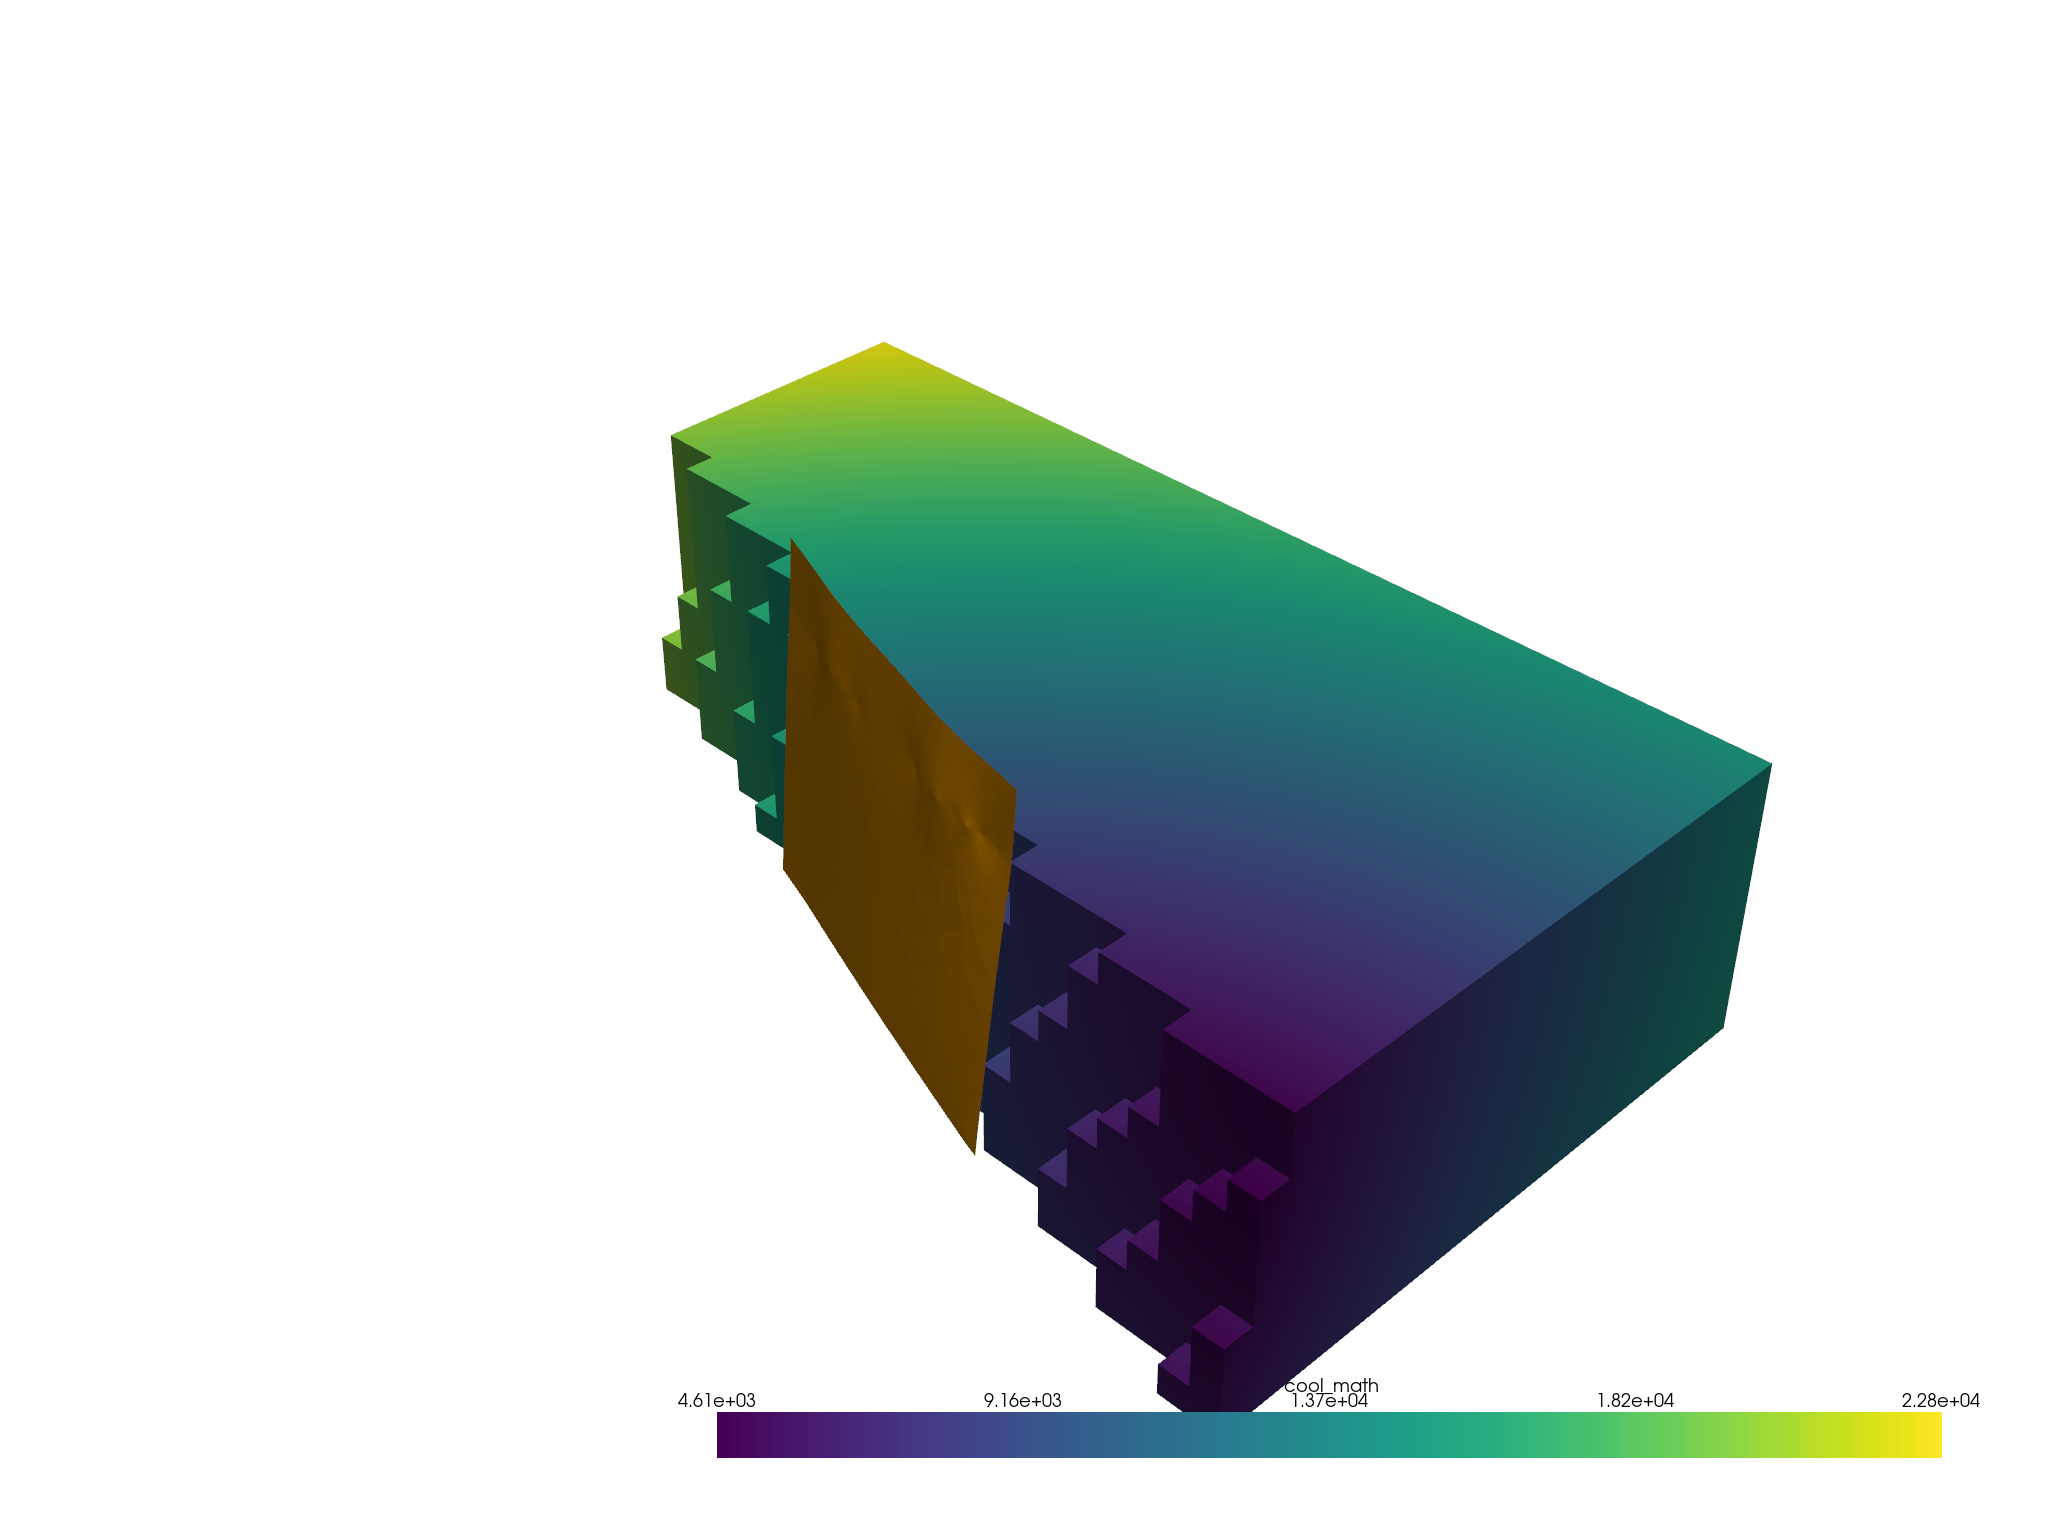
Visualize one side of the masked grid
a = masked.threshold(1.5, scalars="cell_mask", invert=True)

p = pv.Plotter()
p.add_mesh(a, scalars="cool_math")
p.add_mesh(fault, color="orange")
p.show()

Total running time of the script: (0 minutes 6.443 seconds)